Smart Dashboard Analysis
Smart Dashboard Analysis
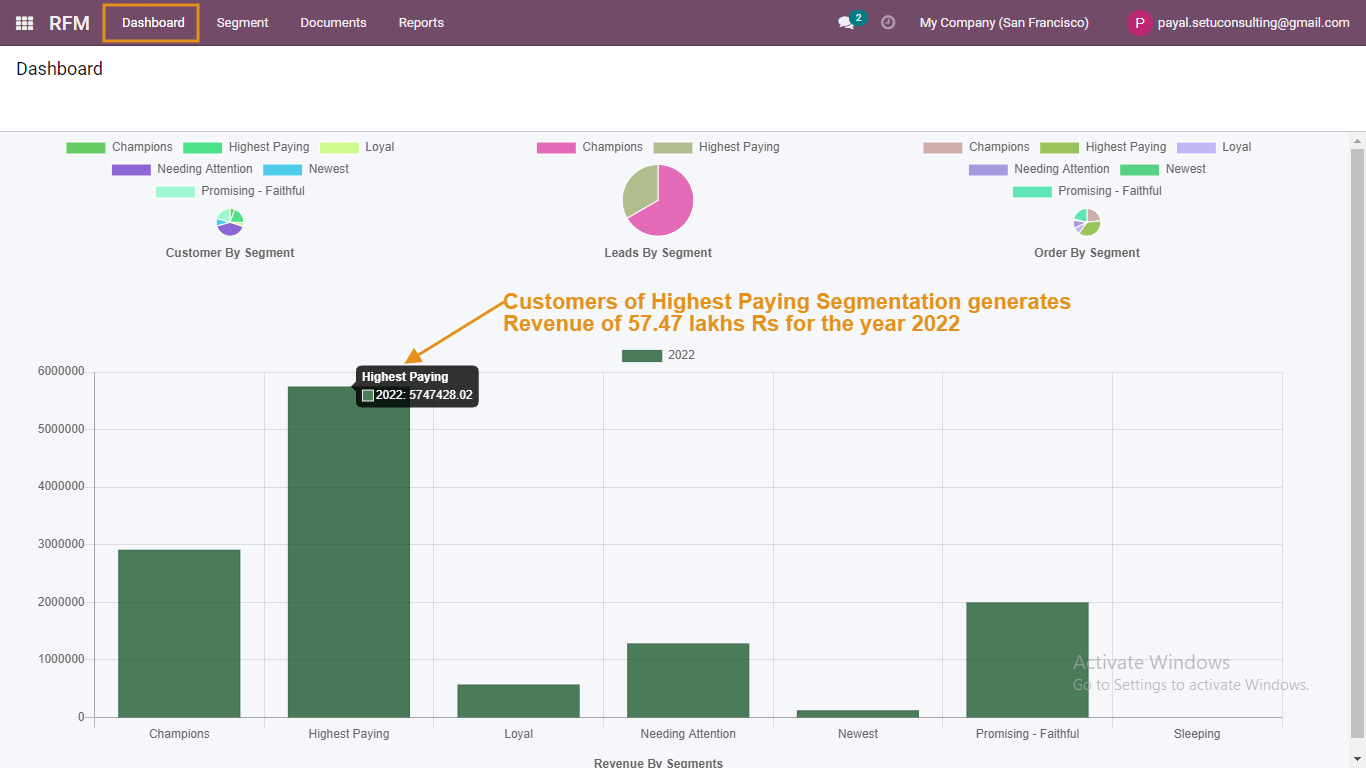
- Dashboard of RFM Analysis appears as shown below
- Various Analyses from the dashboard
- Customers of which segment generate how much Revenue?
- What is the number of customers in each segment?
- How many orders are given by customers now based on the segments to which they belong?
- Compare
- Revenue generation in each period for each segment
- Revenue generation by each segment’s customers
- Number of Customers belonging to each segment
- Number of Orders given by each segment
- Number of Leads generated by each segment
- For example:
- Customers who belong to the highest paying segmentation generate total revenue of 57.47 lakhs Rs for the year 2022
- Likewise from the dashboard itself, you can track
- Customers of which segment generates how much of revenue?
- How much revenue is generated by each segment’s customers every yearThere are no comments for now.
to be the first to leave a comment.