ABC Sales Frequency Analysis Report Overview
ABC Sales Frequency Analysis Report
- ABC Sales Frequency Analysis Report divides all products into 3 categories based on the revenue that it generates

Fig: Classification of Inventory based on Order frequency
- As explained in the figure below.
- Products with 80% of Orders belong to category A
- Products with 15% of Orders belong to category B
- Products with 5% of Orders belong to category C
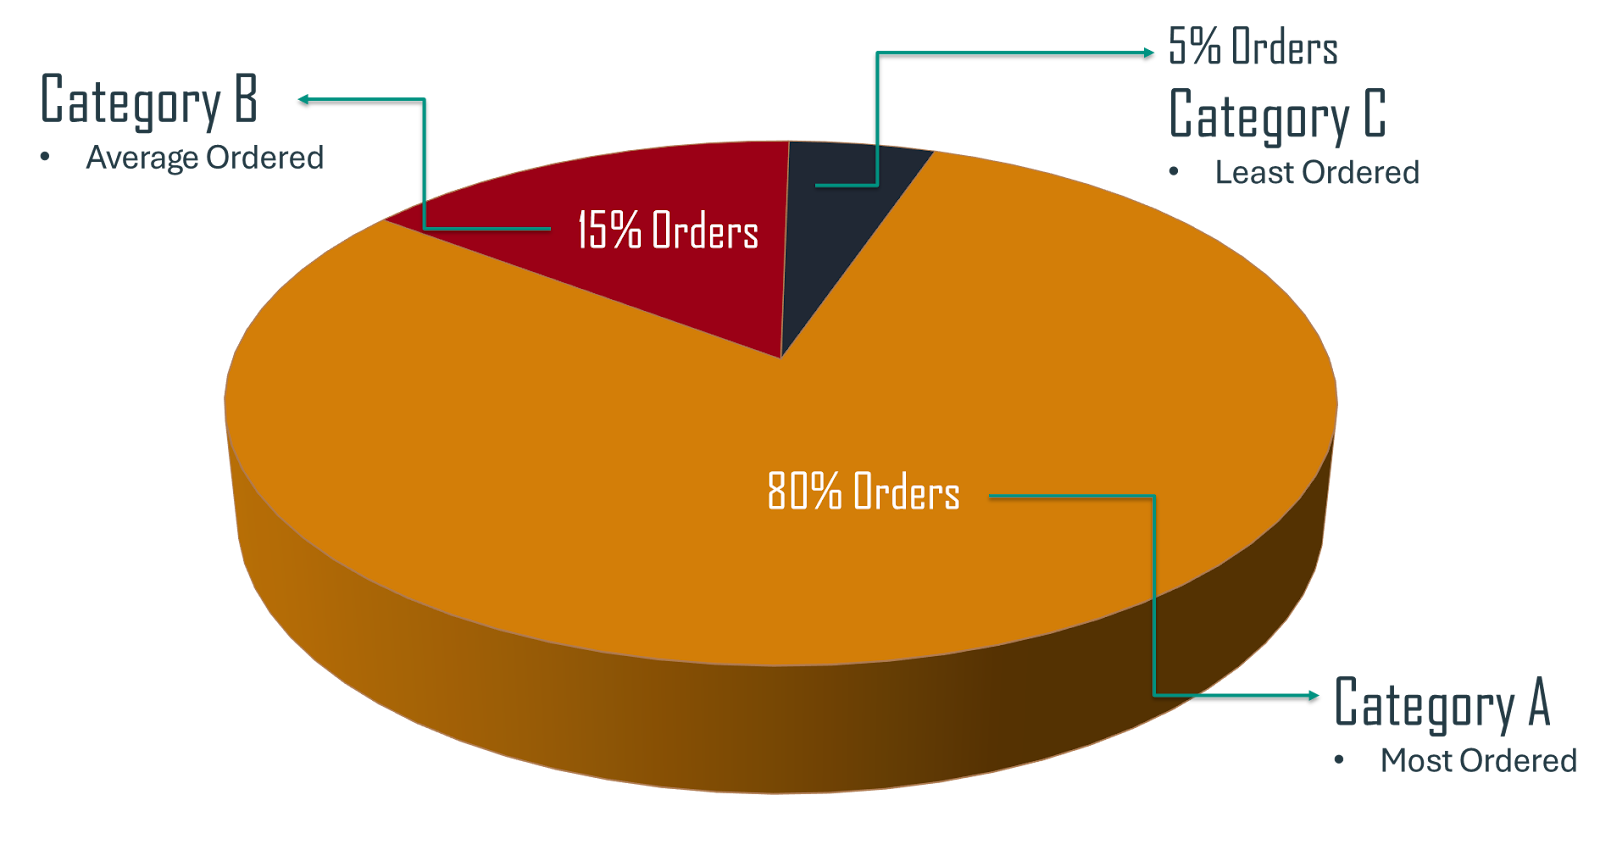
Fig: % Orders of Products
Rating
There are no comments for now.
to be the first to leave a comment.