To generate an inventory turnover analysis report go to
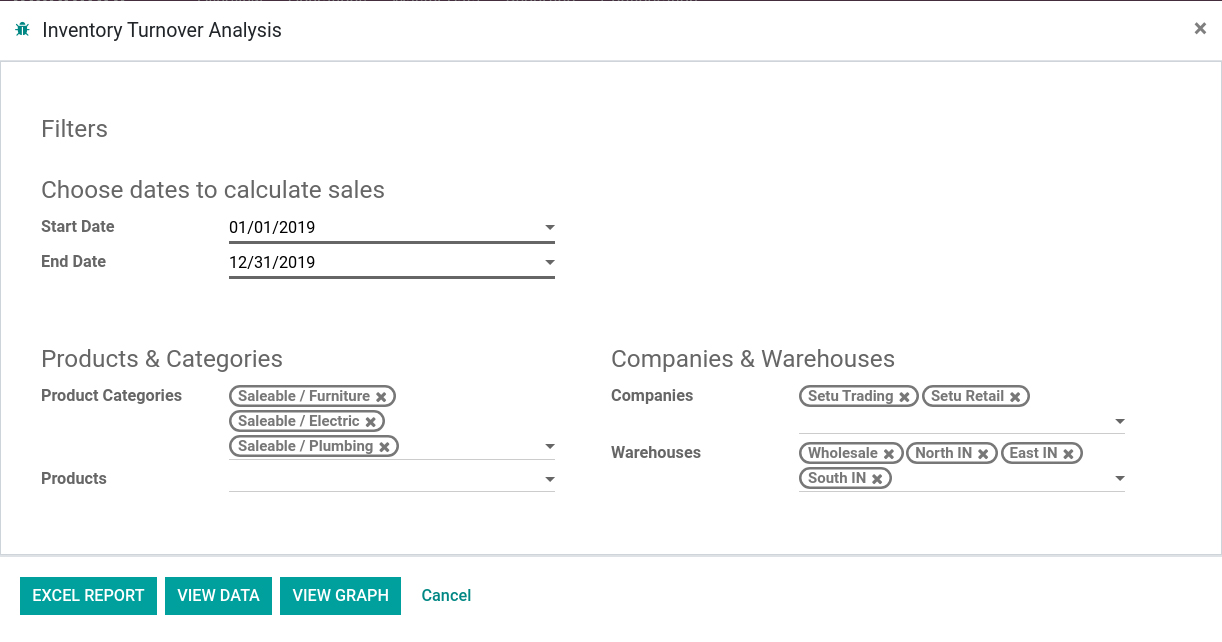
In the wizard select the start date & end date to calculate sales
Users can filter sales data in two ways :
- Products & Categories
- Companies & Warehouses
Group by sales data by Product, Product Category, Company, and Warehouse wise
Generate graph report (bar chart, line chart, pie chart[if the value is negative, piechart will not generate])
Export sales data in excel report